-
Getting Started
-
Garmin Devices
- Garmin Device Firmware Guide
- Check Garmin Device Firmware
- Set up and Connect Garmin Index2 Scale
- Screen Control on Garmin Wearables
- How to charge Garmin devices best
- Wearable and Device ID Management
- Setup: Prepare Wearable Devices
- Compatible Garmin Devices
- Garmin Timezone & Time
- Wifi Capabilities and Restrictions of Garmin Devices
-
Setup
-
Manage
-
Data Collection
- Collect Data: Synchronization Types
- Collect Data: Tablet Sync (multi-sync) with "Fitrockr Hub (Multi-Sync)" app
- Collect Data: Smartphone Sync (single-sync) with Garmin Connect app
- Collect Data: Overview
- Collect Data: Smartphone Sync (single-sync) with Fitrockr app
- Collect Data: Sync via USB cable to Laptop
- Collect Data: Smartphone Sync (single-sync) with Omron Blood Pressure Monitors
- Apple Health and Google Health Connect
- Withings
- Wifi Capabilities and Restrictions of Garmin Devices
- Wearable Sync Methods and Frequencies
-
Track
-
Analyze
-
Other
-
Trouble Shooting
-
Definitions
-
FAQ
- How to use HR monitor strap
- What happens when a Garmin device runs full?
- How to read Accelerometer json output file
- How to get access to Dexcom data
- Which Garmin devices support Wifi sync
- How to free up and reclaim licenses
- How to do a complete data export
- How to enable notifications on the wearable
-
Blog
Analyze: Analytics Studio
The Analytics Studio module allows creation of custom reports, custom data exports, pdf documents and diagram images. The module can be found at Analyze > Analytics Studio.
Configure Report
(1) Click on “Edit”
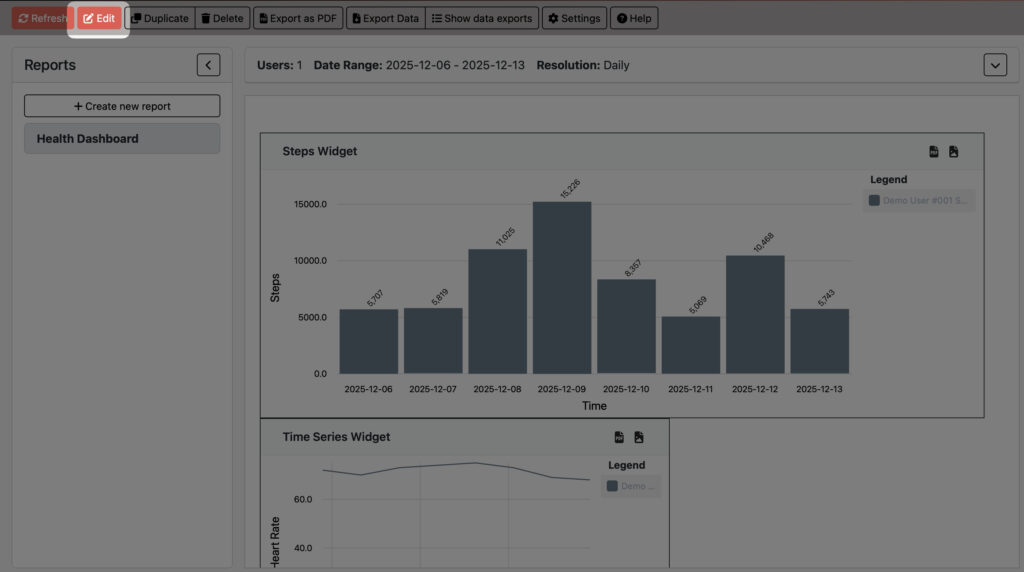
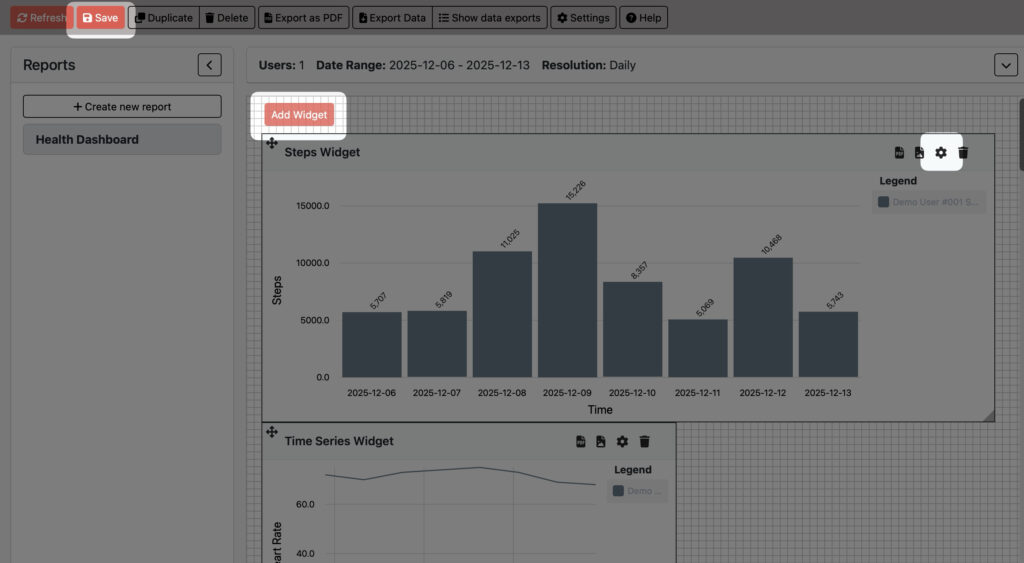
(2) Either adjust the existing widget by clicking on the “Settings” icon or click on “Add Widget” to add a new widget to the dashboard.
(3) Click “Save” to leave the editing mode.
Create & Adjust Report
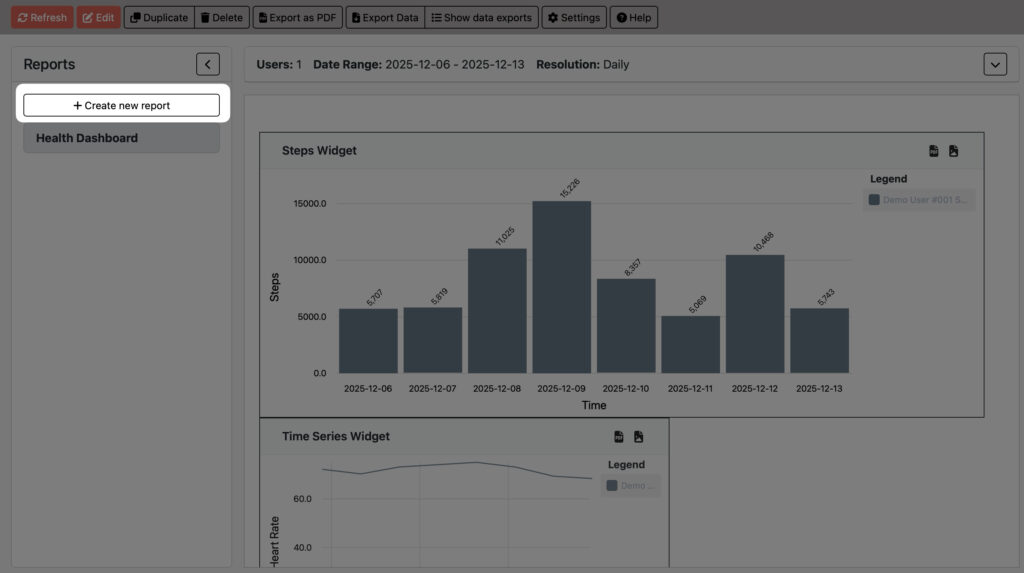
(1) Open left-side panel to access additional functionality.
(2) Click on “Create New Report” to create a new report.
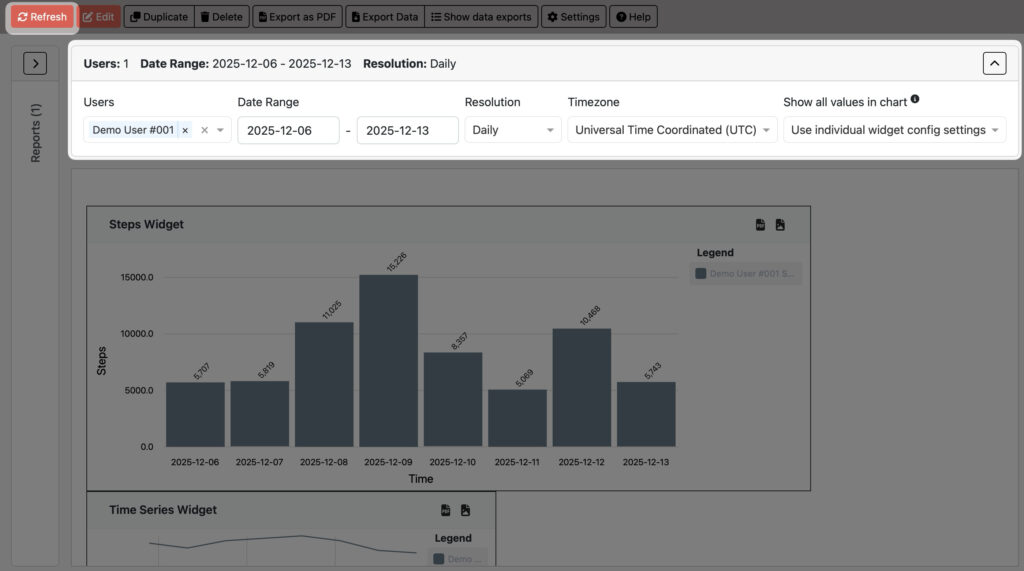
View Report
(1) Open top panel to configure view parameters.
– Users: select single or multiple users. Selecting a group will assign all group members.
– Data Range: select timeframe to be displayed.
– Resolution: select data granularity.
– Timezone: select timezone to be applied to the date range.
– Show values: displays individual values in charts. Only applicable for bar charts. Values can be shown or hidden for all charts or based on the setting per widget.
(2) Click on “Refresh” to refresh data.