-
Getting Started
-
Garmin Devices
- Garmin Device Firmware Guide
- Check Garmin Device Firmware
- Set up and Connect Garmin Index2 Scale
- Screen Control on Garmin Wearables
- How to charge Garmin devices best
- Wearable and Device ID Management
- Setup: Prepare Wearable Devices
- Compatible Garmin Devices
- Garmin Timezone & Time
- Wifi Capabilities and Restrictions of Garmin Devices
-
Setup
-
Manage
-
Data Collection
- Collect Data: Synchronization Types
- Collect Data: Tablet Sync (multi-sync) with "Fitrockr Hub (Multi-Sync)" app
- Collect Data: Smartphone Sync (single-sync) with Garmin Connect app
- Collect Data: Overview
- Collect Data: Smartphone Sync (single-sync) with Fitrockr app
- Collect Data: Sync via USB cable to Laptop
- Collect Data: Smartphone Sync (single-sync) with Omron Blood Pressure Monitors
- Apple Health and Google Health Connect
- Withings
- Wifi Capabilities and Restrictions of Garmin Devices
- Wearable Sync Methods and Frequencies
- Samsung Health
- Oura
-
Track
-
Analyze
-
Other
-
Trouble Shooting
-
Definitions
-
FAQ
- How to use HR monitor strap
- What happens when a Garmin device runs full?
- How to read Accelerometer json output file
- How to get access to Dexcom data
- Which Garmin devices support Wifi sync
- How to free up and reclaim licenses
- How to do a complete data export
- How to enable notifications on the wearable
-
Blog
Track: Data Availability Dashboard
The Data Availability Dashboard module provides a view on the data availability of participants allowing you to identify potential issues during the data collection.
Depending on used wearable, the dashboard automatically adjusts its granularity and information.
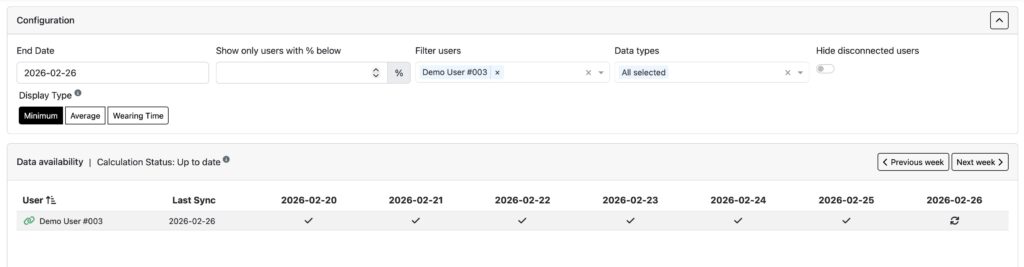
Below is a view that shows if data is generally available per day but it does not calculated the % for each data type during the day because the wearable did not provide this level of granularity information.
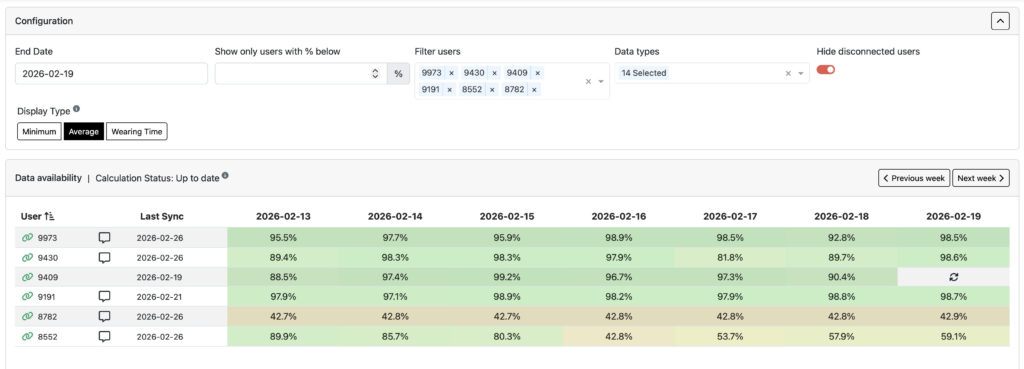
Below is an alternative view that shows % of data available per day because the wearable did provide this level of granularity information.
The dashboard will show you the data availability for each participant. Use the filter criteria to adjust the view:
▶︎ End date: the dashboard shows 7 days and the end date determines the 7th day of the view.
▶︎ Show only users with % below: filter results to only display % below a specific value, e.g. show users with 20% data availability or lower.
▶︎ Filter user: select specific users to be displayed only.
▶︎ Data types: deselect specific data types. For instance, if you have overall low data availability because majority of your participants do not wear the devices during sleep, remove sleep from the data type list to see updated data availability across the remaining data types.
▶︎ Hide disconnected users: hide users that are no longer connected to a device.
▶︎ Display Type: choose how data availability percentage should be calculated:
– Minimum: see the lowest % across all data types per user.
– Average: see the average % value across all data types per user.
– Wearing Time: see only the wearing time % per user.
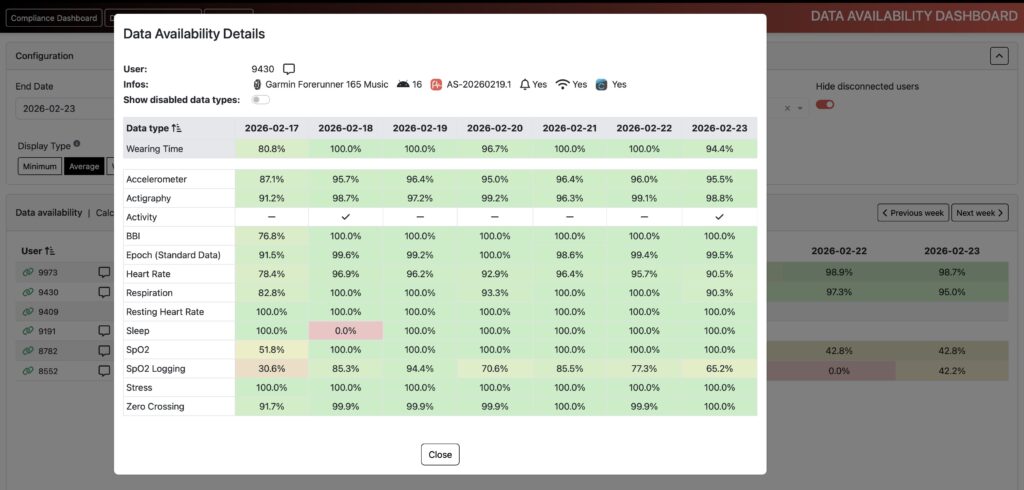
Click on a user to view the detailed data availability for each data type:
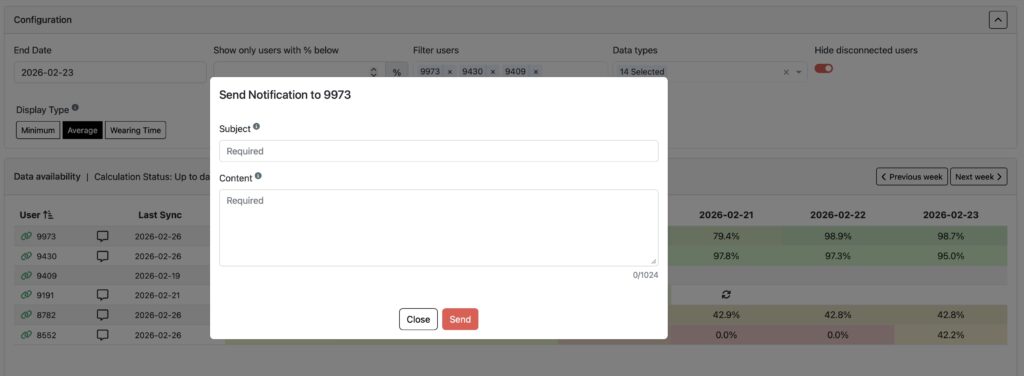
You can directly message a user via the notification icon: