-
Getting Started
-
Wearable
- Garmin Device Firmware Guide
- Check Garmin Device Firmware
- Set up and Connect Garmin Index2 Scale
- Screen Control on Garmin Wearables
- How to charge Garmin devices best
- Wearable and Device ID Management
- Setup: Prepare Wearable Devices
- Compatible Garmin Devices
- Garmin Timezone & Time
- Wifi Capabilities and Restrictions of Garmin Devices
- Screenless bands for blinded data collection
-
Setup
-
Manage
-
Data Collection
- Collect Data: Synchronization Types
- Collect Data: Tablet Sync (multi-sync) with "Fitrockr Hub (Multi-Sync)" app
- Collect Data: Smartphone Sync (single-sync) with Garmin Connect app
- Collect Data: Overview
- Collect Data: Smartphone Sync (single-sync) with Fitrockr app
- Collect Data: Sync via USB cable to Laptop
- Collect Data: Smartphone Sync (single-sync) with Omron Blood Pressure Monitors
- Apple Health and Google Health Connect
- Withings
- Wifi Capabilities and Restrictions of Garmin Devices
- Wearable Sync Methods and Frequencies
- Samsung Health
- Oura
- Polar
- Collect Data: Menstrual Cycle Tracking
- Screenless bands for blinded data collection
- Show all articles (1) Collapse Articles
-
Track
-
Analyze
- Analyze: Overview
- Analyze: Data Export
- Analyze: Standard Reports
- Analyze: Sleep Analysis
- Analyze: Vitality Report
- Analyze: 6 Minute Walk Test
- Analyze: Body Battery
- Analyze: HRV
- Analyze: Activities
- Analyze: Live Streaming
- Analyze: Analytics Studio
- Analyze: Share
- Setup: Onboarding & First Steps
- Analyze: Data Export (Accelerometer & Gyroscope)
-
Other
-
Trouble Shooting
-
Definitions
-
FAQ
- How to use HR monitor strap
- What happens when a Garmin device runs full?
- How to read Accelerometer json output file
- How to get access to Dexcom data
- Which Garmin devices support Wifi sync
- How to free up and reclaim licenses
- How to do a complete data export
- How to enable notifications on the wearable
- Why are some values longer than the given timeframe
- How to pair the Garmin Index Sleep Monitor
- How to get GPS data
- How to check if background sync is enabled
- What does influence sleep measurement and recording
- Why do HR and BBI measurements not fully align?
- What apps are needed to use Fitrockr?
- How to pair and operate the screen-free Garmin CIRQA band?
- Show all articles (1) Collapse Articles
-
Blog
Analyze: HRV (Heart Rate Variability)
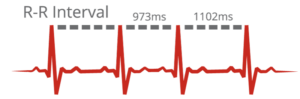
Heart rate variability (HRV) is the physiological phenomenon of variation in the time interval between heartbeats. It is measured by the variation in the beat-to-beat interval (BBI), also called the R-R interval (RRI).
BBI (Beat-to-Beat Interval)
BBI refers to the time between consecutive heartbeats, typically measured in milliseconds (ms). It is derived from the R-R intervals in an electrocardiogram (ECG) or from photoplethysmography (PPG) sensors in wearable devices. Variability in BBI is the foundation of HRV.
When obtaining the time between consecutive heartbeats from a wrist-based wearable, it is often referred to as BBI. If obtained from a chest-based wearable, it is often referred to as RRI. For simplicity, Fitrockr uses the term BBI for both measurements.
Fitrockr provides all day 24/7 raw BBI measurements as well as all day 24/7 enhanced BBI measurements (list of BBI with confidence factor).
HRV (Heart Rate Variability)
HRV is the variation in time between successive heartbeats. It reflects autonomic nervous system (ANS) activity and is widely used to assess cardiovascular health, stress, recovery, and fitness. HRV is influenced by both the sympathetic (fight-or-flight) and parasympathetic (rest-and-digest) branches of the ANS.
The Fitrockr Heart Rate Variability (HRV) Report automatically calculates key HRV metrics from BBI data recorded by a wearable.
The source for all HRV calculations is the following:
▶︎ Enhanced BBI (eBBI) with confidence factor ‘High’. Raw BBI values will be ignored if eBBI is available.
▶︎ Only if eBBI is not available, HRV will be based on Raw BBI with values between 250ms – 2500ms. Values greater than 2500ms and values smaller than 250ms are ignored.
See also below section Data Pre-Processing: Artifact Detection and Correction on further filtering logic.
The HRV Report will provide the following key indices:
– Min BBI: lowest BBI.
– Max BBI: highest BBI.
– Mean BBI: Average beat interval (in ms). AvgBBI is inversely proportional to Heart Rate.

Time-Domain Metrics
All time-domain metrics are calculated directly from the cleaned BBI list (BBI′).
– SDNN: Standard Deviation of NN intervals. Reflects overall Autonomic Nervous System (ANS) activity (total variance).

– RMSSD: Root Mean Square of Successive Differences. The primary measure of Parasympathetic (Vagal) Tone (short-term variability).

– PNN50: percentage of successive RR intervals that differ by more than 50 ms.
Frequency-Domain Metrics
Frequency-domain analysis requires converting the non-uniformly sampled BBI data into a power spectrum using the Fast Fourier Transform (FFT).
– LF: power in the low-frequency range (0.04≤f<0.15).
– HF: power in the low-frequency range (0.15≤f≤0.40).
– LF/HF: ratio of LF to HF power.
– VLF: power in the very low-frequency range (0.003≤f<0.04).
– TP: total power.
Nonlinear Metrics
– SD1/SD2: Derived from the Poincaré plot. The ratio SD1/SD2 is an index of sympathovagal balance.
Output
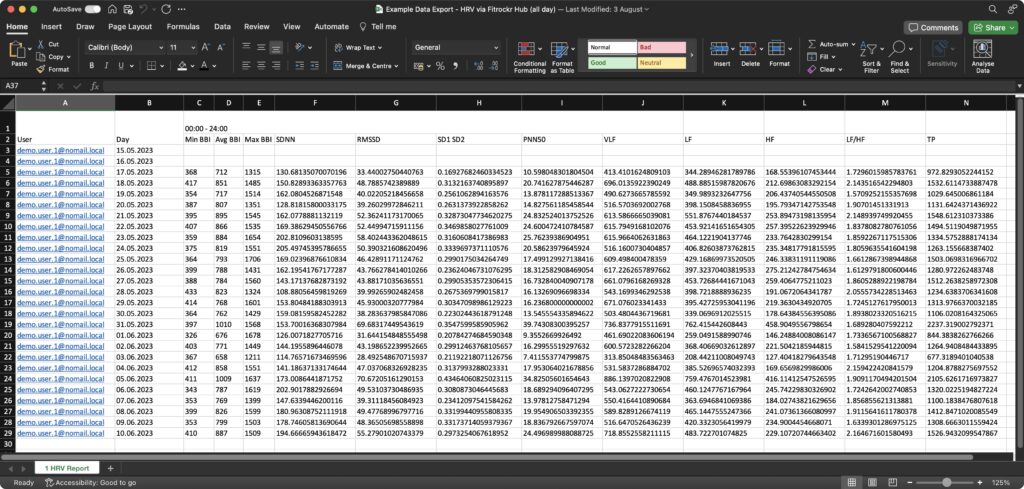
HRV metrics can either be viewed on screen or exported to Excel.
Garmin Connect users: please note that Garmin Connect users will be excluded from report results. Reason is that Garmin Connect does not provide raw BBI data. It will only provide RMSSD during sleep.
Data Pre-Processing: Artifact Detection and Correction
The most critical step for reliable HRV calculation is data cleaning. Outliers (artifacts) such as premature beats or missed beats severely inflate time-domain metrics (RMSSD and SDNN) and distort the frequency spectrum.
Artifact Detection
The algorithm employs a percentage-based filtering method:
An artifact is detected by comparing the current BBI (BBIi) to the previously accepted, cleaned BBI (BBIi-1′).
An artifact is flagged if the absolute percentage change exceeds a predefined threshold (τartifact), typically set between 15% and 25%.
*The implementation uses a default threshold (τartifact) of 20.0%.*
Artifact Correction (Imputation)
When an artifact is detected, the anomalous BBIi is replaced with an imputed value (BBIi′).
The current implementation uses Zero-Order Hold (ZOH). The detected artifact interval is replaced by the value of the preceding cleaned interval:
Frequency-Domain Metrics Calculation (Spectral Analysis)
Frequency-domain analysis requires converting the non-uniformly sampled BBI data into a power spectrum using the Fast Fourier Transform (FFT).
R-Peak Timing and Resampling (Interpolation)
R-Peak Time Generation: R-peak timestamps (Timek) are found by calculating the cumulative sum of the BBI′ values:

1. Resampling: The BBI′ series is resampled onto a new, fixed-rate time axis (Target Rate=4 Hz or a 250 ms interval) using Linear Interpolation.
2. Zero-Padding: The interpolated signal is padded until the total number of samples (N) is the next highest power of 2 for optimal FFT performance.
Fast Fourier Transform (FFT) and Power Spectral Density (PSD)
1. FFT Application: The resampled signal is transformed using the org.apache.commons.math3.transform.FastFourierTransformer.
2. Frequency Bin Calculation: The frequency resolution (Δf) is:
where fs is the sampling frequency (4 Hz) and N is the number of samples.
Power Calculation (PSD)
The power (Pi) in each frequency bin is calculated from the magnitude of the complex result (Yi):