-
Wearables
- How to select the best device for your project
- How to charge Garmin devices best
- Use Garmin HRM PRO Monitor
- Wearable and Device ID Management
- Setup: Prepare Wearable Devices
- Select the right synchronization type for your project
- Make or Buy Decision: Integrating a Wearable API yourself or pay for a plug-n-play solution
- What happens when a Garmin device runs full?
- Check Garmin Device Firmware
- Garmin Device Firmware Guide
-
Privacy & Security
-
Data Analytics
-
API Developer Access
-
Pricing, Plans & Payment
-
User Guides for Fitrockr Control Center
- Setup: Prepare Wearable Devices
- Setup: Projects
- Setup: Staff
- Manage: Users
- Manage: Groups
- Manage: Alerts
- Manage: Notifications
- Manage: Questionnaires
- Collect Data: Overview
- Collect Data: Smartphone Sync (single-sync) with Fitrockr app
- Collect Data: Fitrockr Hub App – Trouble Shooting Guide
- Collect Data: Smartphone Sync (single-sync) with Garmin Connect app
- Collect Data: Tablet Sync (multi-sync) with Fitrockr Hub app
- Collect Data: Tablet Sync (multi-sync) with USB cable
- Collect Data: Trouble shoot syncing issues for multi device sync (multi-sync)
- Collect Data: Sync via USB cable to Laptop
- Analyze: Overview
- Analyze: Data Export
- Analyze: Standard Reports
- Analyze: Sleep Analysis
- Analyze: Vitality Report
- Analyze: 6 Minute Walk Test
- Analyze: Body Battery
- Analyze: HRV
- Analyze: Activities
- Track: Compliance Dashboard
- Track: Device Synchronisation
- Set and Track Goals
- Self-Sign Up for Garmin Connect Users
- Reassign device to another user
- HRV via Garmin Connect Sync
- Self-Sign Up for Apple Watch & Apple Health Users
- Check Garmin Device Firmware
- Garmin Device Firmware Guide
- Show all articles (19) Collapse Articles
-
Participants Resources
-
Live Streaming
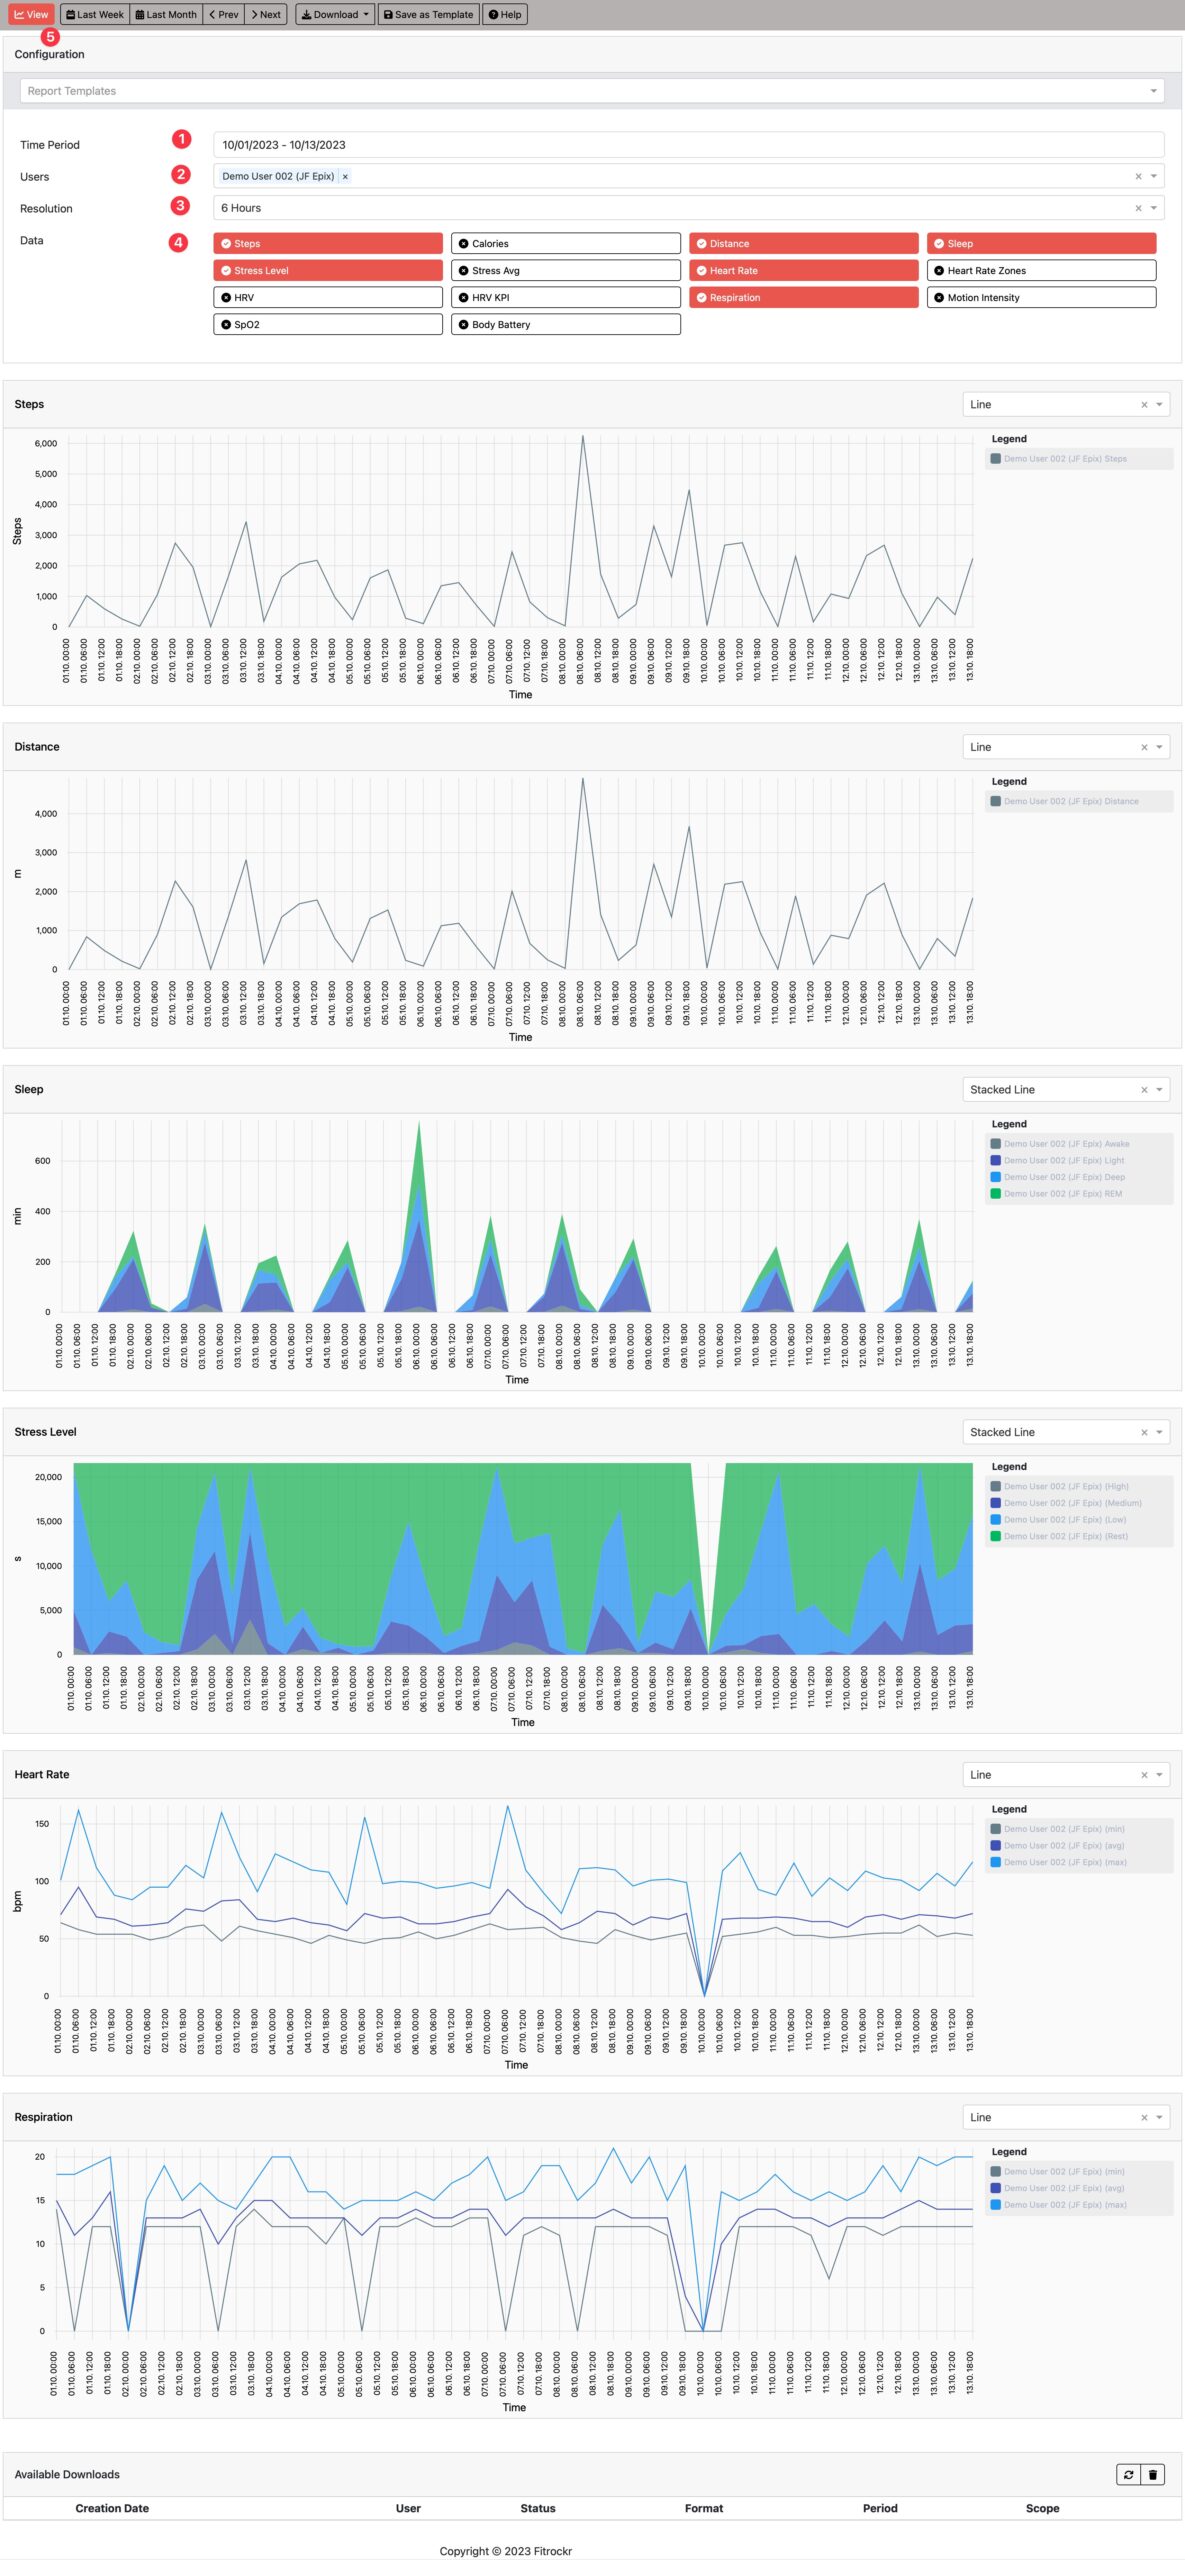
Analyze: Standard Reports
The Standard Reports module provides access to ready-made standard reports to analyze key health data. The report provides various charts, such as Steps, Calories, Distance, Sleep, Stress, Heart Rate, Heart Rate Zones, HRV, HRV Time Domain Respiration, Motion Intensity, SpO2, Body Battery, Skin Temperature, Accelerometer and Gyroscope on a daily and hourly resolution. Data can be viewed as line chart, stacked line chart, pie chart and will include minimum, average and maximum data.
(1) Select time period.
(2) Select user(s).
(3) Select resolution of data.
(4) Select data types.
(5) Click View to generate or refresh the diagram.
Highest resolution is 15mins if time period covers more than one day.
Set time period to one day to expand resolution to 1min increments. This is particularly useful for Accelerometer and Gyroscope.