-
Getting Started
-
Wearable
- Garmin Device Firmware Guide
- Check Garmin Device Firmware
- Set up and Connect Garmin Index2 Scale
- Screen Control on Garmin Wearables
- How to charge Garmin devices best
- Wearable and Device ID Management
- Setup: Prepare Wearable Devices
- Compatible Garmin Devices
- Garmin Timezone & Time
- Wifi Capabilities and Restrictions of Garmin Devices
- Screenless bands for blinded data collection
-
Setup
-
Manage
-
Data Collection
- Collect Data: Synchronization Types
- Collect Data: Tablet Sync (multi-sync) with "Fitrockr Hub (Multi-Sync)" app
- Collect Data: Smartphone Sync (single-sync) with Garmin Connect app
- Collect Data: Overview
- Collect Data: Smartphone Sync (single-sync) with Fitrockr app
- Collect Data: Sync via USB cable to Laptop
- Collect Data: Smartphone Sync (single-sync) with Omron Blood Pressure Monitors
- Apple Health and Google Health Connect
- Withings
- Wifi Capabilities and Restrictions of Garmin Devices
- Wearable Sync Methods and Frequencies
- Samsung Health
- Oura
- Polar
- Collect Data: Menstrual Cycle Tracking
- Screenless bands for blinded data collection
- Show all articles (1) Collapse Articles
-
Track
-
Analyze
- Analyze: Overview
- Analyze: Data Export
- Analyze: Standard Reports
- Analyze: Sleep Analysis
- Analyze: Vitality Report
- Analyze: 6 Minute Walk Test
- Analyze: Body Battery
- Analyze: HRV
- Analyze: Activities
- Analyze: Live Streaming
- Analyze: Analytics Studio
- Analyze: Share
- Setup: Onboarding & First Steps
- Analyze: Data Export (Accelerometer & Gyroscope)
- Setup: Accelerometer & Gyroscope Data Collection
- Analyze: Health Advisory
- Analyze: Drowsiness Detection
- Show all articles (2) Collapse Articles
-
Other
-
Trouble Shooting
-
Definitions
-
FAQ
- How to use HR monitor strap
- What happens when a Garmin device runs full?
- How to read Accelerometer json output file
- How to get access to Dexcom data
- Which Garmin devices support Wifi sync
- How to free up and reclaim licenses
- How to do a complete data export
- How to enable notifications on the wearable
- Why are some values longer than the given timeframe
- How to pair the Garmin Index Sleep Monitor
- How to get GPS data
- How to check if background sync is enabled
- What does influence sleep measurement and recording
- Why do HR and BBI measurements not fully align?
- What apps are needed to use Fitrockr?
- How to pair and operate the screen-free Garmin CIRQA band?
- Is the Garmin CIRQA band suitable for raw accelerometer signal data collection?
- What data is stored and processed at a Fitness Challenge?
- Show all articles (3) Collapse Articles
-
Blog
Analyze: Drowsiness Detection
The drowsiness feature allows for personalized drowsiness risk estimation using physiological and behavioral data collected from a smartwatch. Importantly, this feature takes advantage of Garmin-specific metrics such as stress and body battery and is not yet applicable to other wearable brands.
The feature evaluates the most recent 45 minutes of wearable data and generates scheduled reports at regular intervals. Each report provides an estimated drowsiness probability for that 45-minute period. Risk levels can be interpreted as follows:
- Low risk = < 50%
- Mild risk = 50% – 69%
- Moderate risk = 70% – 89%
- High risk = ≥90%.
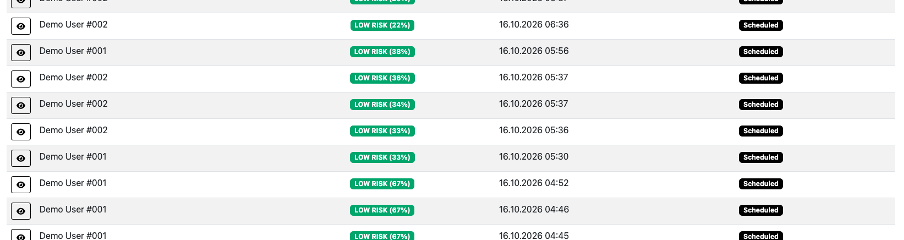
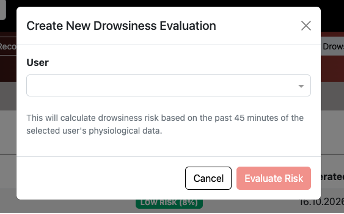
Incoming reports automatically appear on a scheduled basis, but there is also an option to generate a manual report for a user based on the most recent 45-minute period.
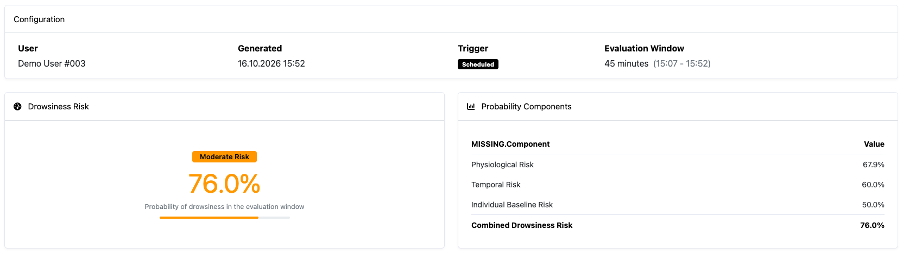
To explore the factors which contributed to the drowsiness risk score, you can click into each triggered report using the ‘eye’ icon. This displays the drowsiness probability for that time-period, alongside a breakdown of the different components contributing to the score:
- Physiological risk: assesses whether the individual’s current physiological state shows patterns associated with drowsiness. The most recent 45-minute averages are compared with the individual’s physiological baseline from the past 14 days.
- Temporal risk: accounts for the time of day, acknowledging typical periods of drowsiness, such as late afternoon or early morning.
- Individual baseline risk: reflects the individual’s history of drowsiness detection, where available. This indicates how frequently that individual tends to get drowsy.
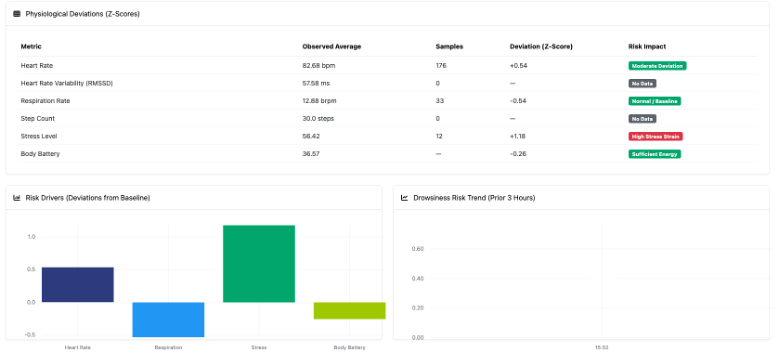
You can also scroll down on the platform to explore the individual physiological and behavioral trends which contributed to the risk score. For each feature, the current observed average value is displayed, alongside the amount of data which was available determine that average, the level of deviation from the individual’s 14-day baseline (a Z-score*), and the impact that this has on the risk score.
These Z-scores are also visualized on a graph, where you can see whether each feature has increased or decreased from the baseline value for that specific time-period.
Finally, there is also a drowsiness risk trend, whereby the level of drowsiness for the past 3 hours for that individual is displayed. This helps indicate whether the current drowsiness detection is stable, or increasing or decreasing over time. This supports suitable action on incoming alerts.
*Z-score: the number of standard deviations that the selected value differs from the user’s rolling 14-day baseline. A positive Z-score indicates that the current value is above baseline, while a negative score indicates that it is below.